Entry One:
The nature of Geography
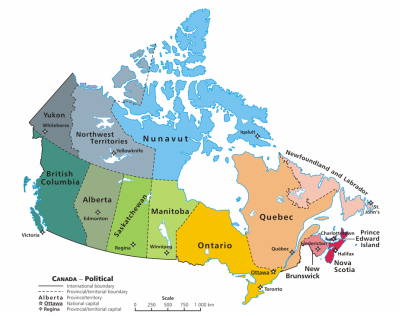
Regional Map |
Country Specific Map |
|

|
Main InformationTotal Area: 9,984,670 sq km
Land Area: 9,093,507 sq km Water Area: 891,163 sq km Size Comparative to US Territory: slightly larger than the US |
all countries that share a border |
Total Distance of coastline |
|
The only country that shares a border with Canada is the United States. This covers 8,893 km of Canada's borders.
|
The total distance of coastline is 202,080 km.
|
climate and terrain |
Elevation |
|
The climate varies from temperate in the south to subarctic and arctic in the north.
The terrain contains mostly plains with mountains in the west and lowlands in the southeast. |
Point of lowest elevation: Atlantic Ocean 0 m
Point of highest elevation: Mount Logan 5,959 m |


Entry two:
Population and migration
Population info |
Growth/decrease |
|
Population: 35,099,836
Population density: Net Migration Rate: 5.66/1000 people |
Crude Birth Rate: 10.28
Crude Death Rate: 8.42 Rate of Natural Increase: 10.28 - 8.42 = 1.86 Population Growth Rate: 0.75% |
dependent population |
life expectancy |
|
Population ages <15: 15.44%
Population ages 65+: 18.18% Dependency Ratio: 33.62% |
At Birth (Total): 81.9 years
At Birth Females: 84.6 years At Birth Males: 79.2 years |
Education
|
There is no available information for the percentage of Canadians attending primary or secondary school. This is probably due to the general assumption that every citizen attends school because it is illegal not to attend.
|

|
Economy/wealth

|
GNI PPP per capita in US dollars: $43,970
Economically Active Females 15+: 63% Economically Active Males 15+: 73% Mobile Phone Subscribers: 81/100 people Motor Vehicles: 608/1000 people |
health
|
There are very minimal health problems of those problems that are prevalent in the rest of the world and in developing countries. There is no available information on the percentage of HIV/AIDS infected people, malnourished population, or underweight children under the age of 5.
|

|
population pyramids


Demographic transition model

|
Canada is currently in Stage 4 of the demographic transition model. The crude birth rate is 10.28 while the crude death rate is 8.42, resulting in a Rate of Natural Increase of 1.86. This is a relatively low rate of natural increase compared to many countries in the world making it easy to conclude solely off the DTM that Canada is one of the more developed countries of the world.
|
gapminder active chart (Crude Birth rate vs women of reproductive age mean years in school)
link: www.bit.ly/2djTfJG
|
As time goes by from 1970 to 2009, Canada's crude birth rate decreases then slightly increases towards the turn of the twenty-first century, and the women of reproductive age's mean years in school increase significantly. The increase mean years in school for women of reproductive age demonstrates the improvements in gender equality in terms of education. The decrease in crude birth rate shows that with education, women have much more to do than stay at home and take care of children, and they also have more knowledge on future planning. This shows that through educational improvements and advancements in gender equality, Canada has started its improvement in decreasing its population growth. This decrease in population growth also leads to Canada's demographic transition from Stage 3 to 4 or Stage 4 to 5.
|

|
